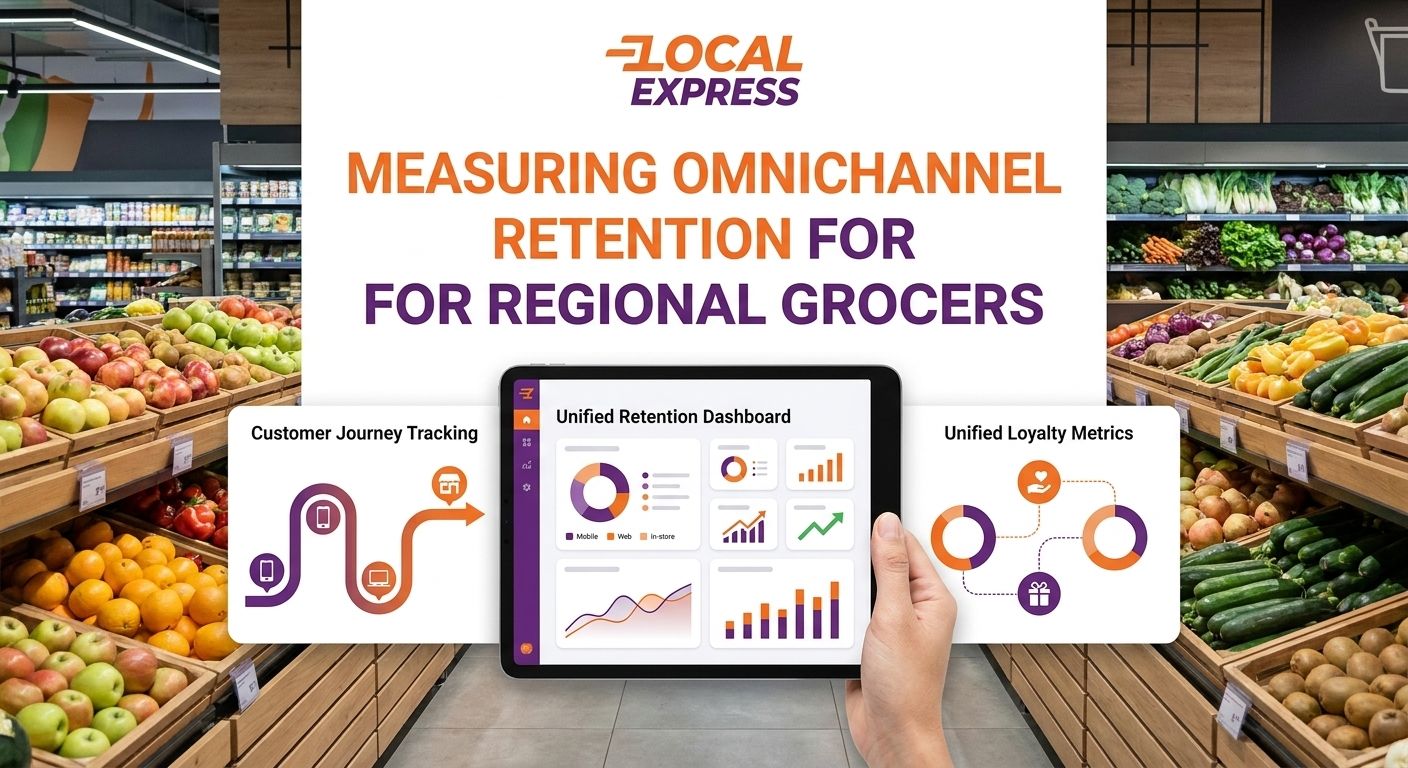
Omnichannel grocery customer retention is the number that tells you whether a shopper who orders online, picks up curbside, and uses your self-checkout kiosk this month is still buying from you next quarter — not whether your app download count looks good in a board deck.
- Omnichannel grocery customer retention only means something once web, app, and kiosk orders share one customer ID.
- Calculate repeat purchase rate separately by channel before you blend them — blended numbers hide where shoppers actually leave.
- Centralized order management across web, app, and kiosk channels is the single fix that makes cross-channel retention math possible.
- Cart abandonment on your ecommerce site drags blended retention down no matter how much you spend on loyalty.
- Loyalty and SMS tools only lift retention after purchase history syncs across every channel a shopper touches.
Why this matters
Most regional grocers report retention as one number — a single repeat-purchase percentage pulled from a POS report or an ecommerce dashboard. That number is almost always wrong, because it's measuring one channel and calling it the whole customer.
A shopper who orders groceries through your app on Tuesday, picks up a rotisserie chicken from your kiosk on Friday, and buys produce in-store on Saturday looks like three different customers if those systems don't talk to each other. Retention reporting built on siloed data overstates churn, understates loyalty program value, and points marketing dollars at the wrong problem.
Getting centralized order management across web, app, and kiosk channels in place before you calculate anything is the difference between a retention report you can act on in 2026 and one that just looks tidy in a spreadsheet.
What you'll need
- A single customer identifier that ties web, app, kiosk, and delivery orders together — email, phone, or loyalty ID all work if applied consistently
- Order-level transaction history for at least the last two full quarters, ideally 12 months
- A defined retention window (90-day and 180-day cohorts are the two most useful for grocery)
- Loyalty program enrollment data, if you run one
- A reporting cadence — weekly pulls, monthly review, quarterly business reporting
- Someone who owns the number — retention reporting that nobody owns doesn't get acted on
The steps
1. Unify your customer ID across every channel
Before any retention math means anything, every order — web, app, kiosk, delivery — needs to resolve to one customer record. If your kiosk orders are anonymous or your delivery orders live in a separate system from your ecommerce site, you're measuring three partial pictures instead of one customer.
Common mistake: treating guest checkout as a data gap instead of a fixable one. Prompt for phone number or loyalty lookup at checkout on every channel, including the kiosk.
2. Define your retention window and cohort
Pick a window that matches how often a household actually buys groceries — 90 days catches most regular shoppers, 180 days catches occasional or seasonal ones. Build cohorts by first-purchase month so you can compare, say, your March 2026 cohort against your March 2025 cohort on equal footing.
Common mistake: comparing calendar-month retention to calendar-month retention without cohorting by acquisition date. That comparison always looks noisy because it mixes shoppers at different points in their lifecycle.
3. Calculate repeat purchase rate by channel, then blended
Repeat purchase rate is repeat customers in the window divided by total customers in the window. Run this separately for app-only shoppers, web-only shoppers, kiosk-only shoppers, and multi-channel shoppers before you blend them into one figure.
For example, if your app cohort shows a 40% repeat rate and your web-only cohort shows 12%, blending them into a single 26% "retention rate" hides the real story: your app experience is working and your web checkout isn't.
Common mistake: reporting the blended number to leadership and never breaking it back out. The blended number is the least useful number in the whole exercise.
4. Measure customer lifetime value, single-channel vs. multi-channel
Pull average order value and order frequency for shoppers who use one channel versus shoppers who use two or more. Multi-channel shoppers — the ones who order online and pick up at the kiosk, or shop in-store and get delivery for a heavy order — consistently show higher basket sizes than single-channel shoppers in most grocery data sets, because they're using you for more of their shopping trips, not fewer.
Common mistake: treating channel expansion as a cost center instead of a retention lever. A shopper using two channels is telling you they trust you enough to route more of their spend your way.
5. Track cross-channel migration
Watch what happens when a web-only shopper starts using your app, or when an in-store shopper starts ordering delivery. That migration — not raw channel count — is often the leading indicator that a shopper is becoming a loyal one rather than a one-time convenience buyer.
Common mistake: ignoring migration data because it's harder to pull than a simple repeat-rate report. It's the metric that predicts churn before it shows up in the retention number.
6. Layer in cart abandonment and reactivation data
A shopper who abandons a cart on your ecommerce site three times in a quarter is a retention risk, even if their loyalty card still swipes in-store every week. Reducing cart abandonment on your grocery ecommerce website closes one of the most common gaps between what looks like healthy in-store retention and what's actually a shrinking online relationship.
Common mistake: measuring retention only on completed orders. Abandoned carts are early warning data — treat them as part of the retention picture, not a separate ecommerce metric.
7. Report retention against delivery experience and marketing touch points
Delivery reliability drives repeat behavior more than most grocers give it credit for — a late or damaged delivery order does more damage to a customer relationship than a single bad in-store visit, because the shopper chose the channel expecting convenience. Route efficiency and on-time performance, covered in route optimization software for grocery last-mile delivery, belongs in the same retention report as your repeat-purchase numbers, not a separate operations deck.
Common mistake: reporting marketing-driven retention (email opens, SMS clicks) without connecting it to whether the order that followed actually showed up on time.
See your orders in one dashboard
Unify web, app, and kiosk order data before you run the retention math.
Troubleshooting
Duplicate customer records across channels. If the same shopper shows up as three separate customer IDs, your retention rate is mathematically wrong before you calculate anything. Fix the ID matching logic first — everything downstream depends on it.
Kiosk orders with no customer capture. Anonymous kiosk transactions can't be tied to a retention cohort. Add a phone number or loyalty lookup prompt at the kiosk, even for a quick prepared-food order.
Retention rate looks stable but revenue per customer is falling. A shopper can keep showing up and still be spending less each visit — usually a sign they've started splitting their basket with a marketplace or a competitor. Track average order value alongside repeat rate, not instead of it.
Data lag between POS and ecommerce systems. If your in-store POS updates nightly and your app updates in real time, any retention report pulled mid-cycle will be off. Standardize the pull time across systems before comparing channels.
Loyalty enrollment not tied to online orders. A shopper can be enrolled in your loyalty program in-store and still show up as a new customer online. Push loyalty ID capture into checkout on every channel, not just the register.
Tools and resources
- A unified order management system that pulls web, app, kiosk, and delivery orders into one record — this is the prerequisite for every step above
- A loyalty program tied to a single customer ID across channels, not a separate card system per location
- SMS and push messaging tools that can target a shopper based on cross-channel behavior, not just their last channel
- A delivery operations report that tracks on-time performance alongside repeat purchase data
- A reporting cadence someone actually owns — weekly data pulls, monthly retention review, quarterly reporting to leadership
The next lever after retention reporting is usually loyalty and messaging — once you can see which channel a repeat shopper actually prefers, you can target them there instead of guessing across all three.
FAQ
What is omnichannel grocery customer retention?
Omnichannel grocery customer retention measures whether a shopper who buys through your website, app, or kiosk keeps buying from you across any of those channels over time. It requires one customer ID tied to every channel — otherwise a repeat shopper can look like three separate new customers.
How do you calculate retention across web, app, and kiosk orders?
Divide repeat customers in a defined window (typically 90 or 180 days) by total customers in that window, calculated separately for each channel before blending. Blending too early hides which channel is actually driving repeat behavior.
What's a good repeat purchase rate for a regional grocer in 2026?
There's no single industry benchmark every grocer can rely on for 2026 — the number that matters is whether your own rate is holding steady or climbing quarter over quarter across every channel you track. A repeat rate that's rising in-app but flat online tells you exactly where to focus.
Is app-based retention better than web-only retention?
App shoppers typically show higher repeat rates than web-only shoppers because the app removes friction from reordering. That doesn't mean web traffic is worthless — it often means your web checkout has a conversion or retention gap worth fixing before pushing more traffic there.
How often should you review omnichannel retention data?
Pull the data weekly and review it monthly at minimum, with a full quarterly report to leadership. Retention shifts show up gradually, so a monthly cadence catches problems before they show up in quarterly revenue.
Does a loyalty program improve omnichannel retention?
A loyalty program improves retention only when the loyalty ID is tied to every channel a shopper uses, including kiosk and delivery orders. A loyalty card that only tracks in-store swipes misses the online half of the customer relationship.
What causes retention numbers to look inflated?
Duplicate customer records across systems, or measuring only completed orders while ignoring abandoned carts, both inflate a retention number. The fix is a single customer ID and including abandonment data in the same report.
How does delivery experience affect retention?
A late or damaged delivery order damages a customer relationship more than a single bad in-store visit, because the shopper chose that channel expecting convenience. On-time delivery performance should sit in the same retention report as repeat-purchase data, not a separate operations dashboard.
One last thing
The grocers who get omnichannel retention right in 2026 aren't the ones with the fanciest loyalty app — they're the ones who can tell you, by name, which channel a specific repeat shopper actually prefers, and why. That level of detail only comes from order data that's unified before the math starts, not after.